Are We Building the Perfect Storm for a Global Market Crash? An Economic Recession Warning
- Jul 24, 2025
- 8 min read
By Floyd Saunders, Founder of Really Simple Investing
Assessing Concerns in Financial Markets and the Economy
Here is what I am concerned about in the financial markets as we approach the end of summer, 2025: falling foreign demand for Treasuries, a ballooning national debt, a decline in the value of the dollar, tariffs raising prices, weakening consumer confidence, and softening macro data could line up into potential for a global market crash. If we see a decline in either the bond market or the stock market tipped my any of these factors it might be a perfect storm for market correction or crash.
Key takeaways
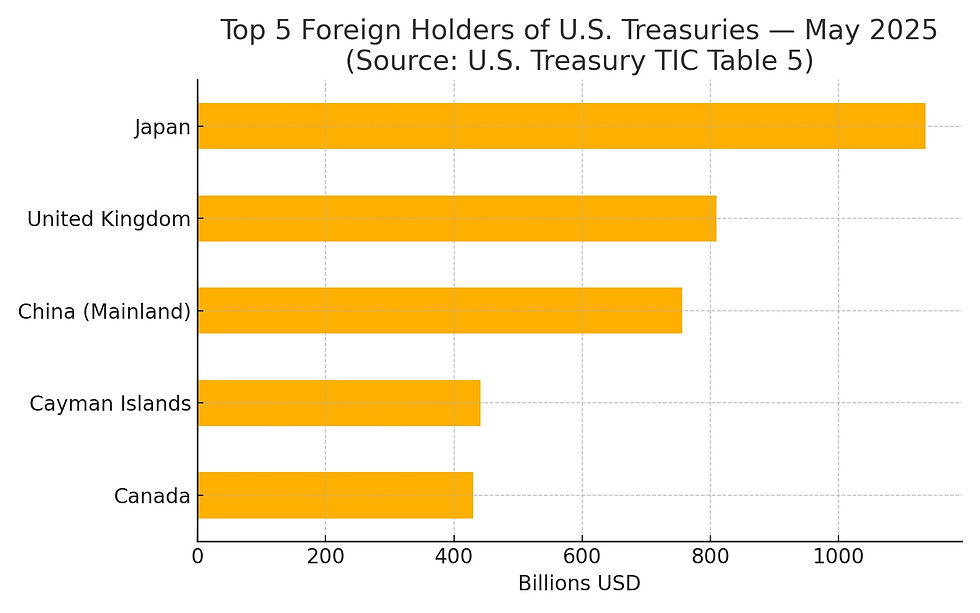
China hasn’t dumped 50% of its Treasuries overnight, but its holdings have fallen to the lowest level since 2009 (≈$756B in May 2025), down ~40%+ from the 2013 peak of $1.32T—a structural headwind for marginal demand of U.S. debt. ReutersReutersCEIC DataFinancial Times
The U.S. dollar is still the world’s reserve currency, holding ~57.8% of allocated reserves in 4Q 2024, but the long‑run trend is a gradual erosion toward “nontraditional” currencies—adding fragility should confidence waver. IMF DataIMFColumbia Threadneedle Investments
Tariffs are inflationary taxes that raise costs for households and firms; rigorous estimates put the impact at ~+2.5% on consumer prices for recent large tariff packages—demand-destructive if incomes don’t keep pace. PIIEPIIE
Mood and momentum are softening: Conference Board consumer confidence slid to 93.0 in June, recession-signaling expectations remain sub‑80, while University of Michigan sentiment in July only ticked to 61.8. The Conference BoardReutersMarketWatch
Macro data aren’t flashing “crash” yet but are not comforting either: Retail sales rose 0.6% in June while inflation re-accelerated to 2.7% YoY and unemployment is 4.1%—stable, but higher than cycle lows. Census.govBureau of Labor StatisticsBureau of Labor Statistics
Let’s clear the headline first: China has not suddenly dumped 50% of its U.S. Treasury portfolio. But it has been systematically reducing exposure for years—from an all‑time high of about $1.32 trillion in 2013 to roughly $756 billion in May 2025, the lowest since 2009. Here is how China and Japan compare as holders of U.S. Treasury Bonds from 2020 to 225.
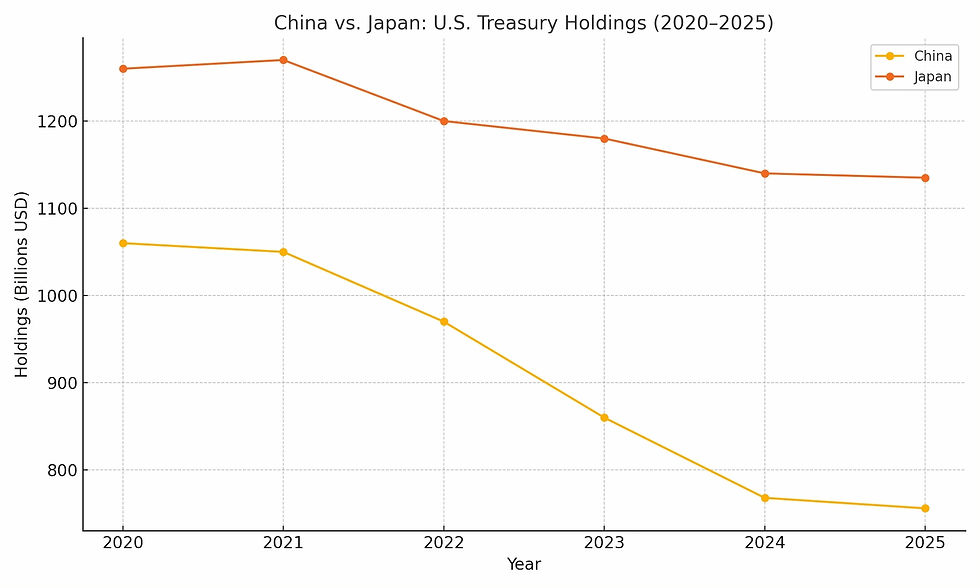
That’s a ~42–45% decline from the peak, and it continues: May marked the fourth straight monthly drop. Motivations include defending the yuan, diversification, responding the new tariffs from the United States and geopolitical risk management. Financial Times
According to Reuters, "On its own, this doesn’t crash the Treasury market—foreign holdings overall are still hovering around a record ~$9T—but it removes a once-reliable buyer at the margin precisely when U.S. fiscal needs are ballooning and rating agencies are sounding alarms." Reuters.
"Traditionally a refuge for markets, Treasuries have been volatile since April, becoming less attractive for overseas investors as Trump's erratic policies on tariffs and taxes drove them to pare exposure to the dollar and U.S. markets.
Risk vector: If China (and others) keep trimming, the Treasury’s term premium can drift higher, pushing up global discount rates, compressing equity valuations, and tightening financial conditions—especially if domestic buyers demand more yield to absorb the glut. Reuters
Dollar dominance: still on top, but hairline cracks are visible
Contrary to the “end of the dollar” narrative, the greenback’s share of global reserves actually ticked up to 57.8% in Q4 2024, per the IMF’s COFER data. But the decade-long trend is gradual decline, with diversification toward gold and “nontraditional” currencies (CAD, AUD, KRW, SGD, RMB, etc.). In other words: the dollar is dominant, but not invulnerable. Columbia Threadneedle Investments
Risk: A confidence shock (e.g., a messy debt-ceiling episode, another rating downgrade, or policy-induced inflation via tariffs and deficit-funded tax cuts) could accelerate diversification, raising U.S. borrowing costs and amplifying market stress. Reuters
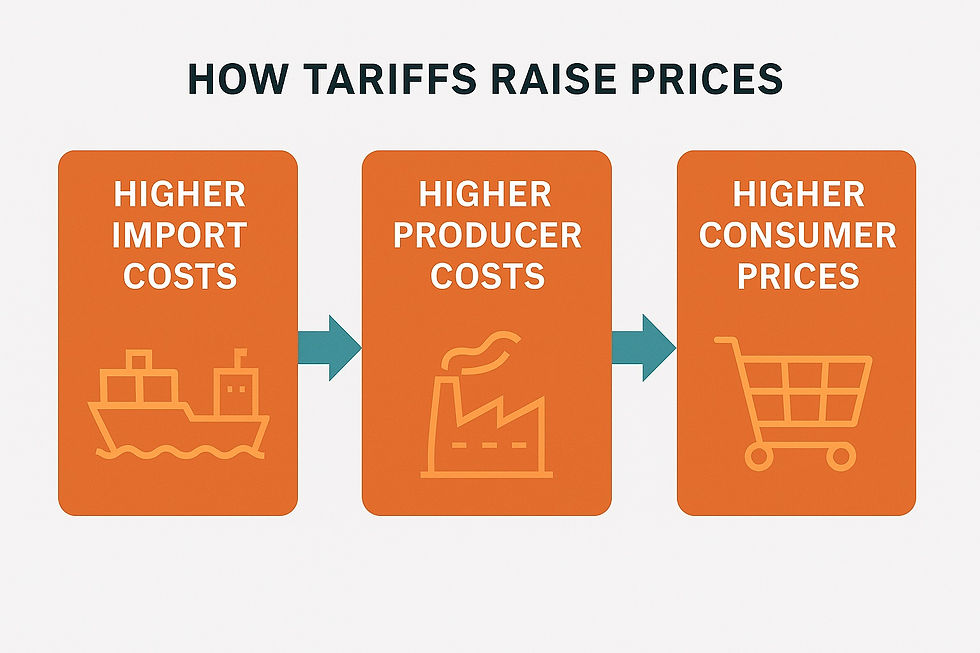
Tariffs: invisible today, inflationary tomorrow
Economists keep repeating it because it’s true: tariffs are taxes. They raise costs for importers, which then flow through to consumers and domestic producers that compete with imports. The Peterson Institute estimates that recent broad tariff proposals could lift consumer prices ~2.5% and shave 0.5% off GDP—not catastrophic alone, but a meaningful drag when growth is already slowing. PIIEPIIE
While headline CPI accelerated to 2.7% YoY in June (from 2.4%), some of the tariff pass‑through is delayed because firms draw down inventories or compress margins first. As stockpiles run out, the bite can intensify—just as consumers are already fatigued. Bureau of Labor Statistics
Risk: Policy-driven, “sticky” inflation keeps real incomes under pressure and forces yields higher, squeezing equity multiples, private credit, CRE, and over-levered balance sheets.
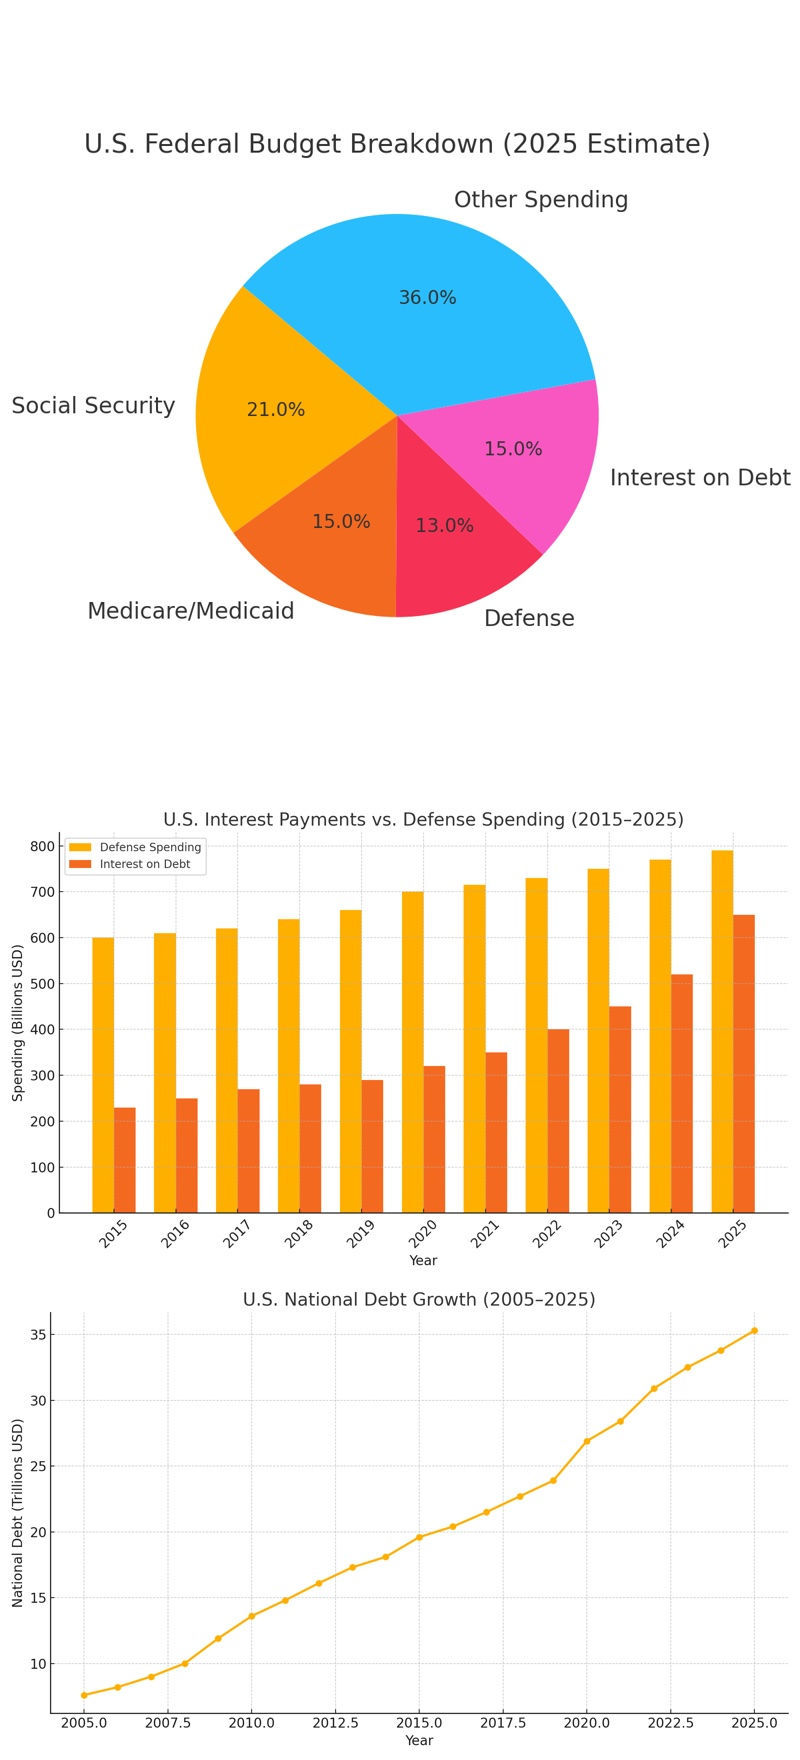
Deficits are Growing, Is that a Problem?
Short answer to the problem with a growing national deficit is Yes, it is a problem. Here is why, with higher interest rates to cope with inflation, it costs more to pay back that debt. Its is same as the high interest on consumer debt. It is also likely to reduced private investment due to "crowding out," potential inflation, and long-term negative impacts on economic growth and living standard. If we don't reduce deficits it could cause reductions in the value of the dollar and lead to a sovereign debt crisis. If all or some of these financial and economic factors turn negative, investors could turn more and more to cryptocurrencies, reducing their use of U.S. dollars.
Confidence, sentiment, and spending: the oxygen of the cycle is thinning
Two major gauges tell a similar story:
Conference Board Consumer Confidence fell to 93.0 in June, and its Expectations Index sits at 69.0—well below the 80 line that often precedes recession. The Conference Board
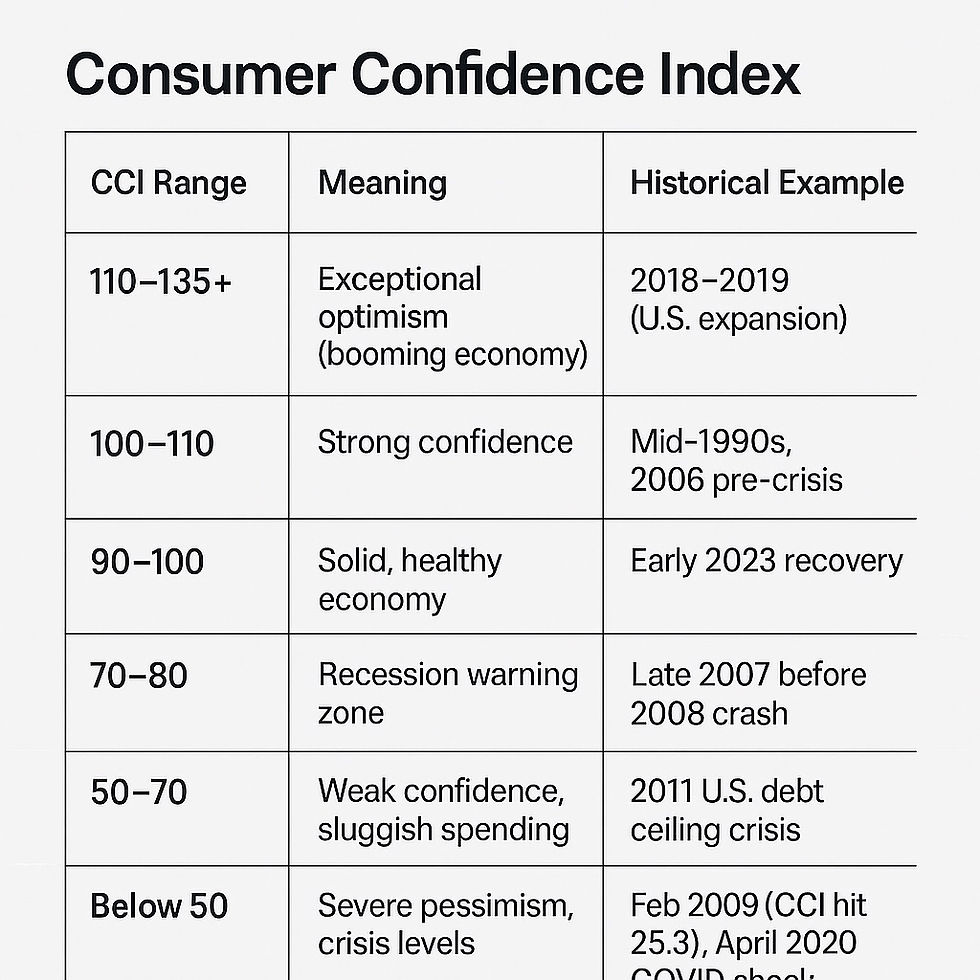
Consumer Confidence: Good vs. Bad Numbers
Good: A Conference Board Consumer Confidence Index (CCI) of 100 or above indicates strong optimism and a healthy economy. 90–100 is solid, while 110–120+ signals exceptional confidence.
Not So Good: Below 80 is often a recession warning. 50–70 reflects weak confidence and sluggish spending. Below 50 indicates severe pessimism, seen during crises like 2008 (CCI fell to 25.3).
University of Michigan sentiment improved to 61.8 in July, but that’s still far below pre‑COVID norms, and short‑ and long‑run inflation expectations, while easing, remain elevated versus the Fed’s target. MarketWatch
Retail sales were up 0.6% in June, but with CPI at 2.7% YoY, real spending momentum is tepid. Unemployment is 4.1%—not high, but no longer falling, and breadth measures across states show more pockets of weakness. If the labor market cracks, sentiment will follow. Bureau of Labor Statistics
Risk: Confidence is a coincident/leading hybrid—if it keeps sliding while rates stay elevated, the feedback loop into retail sales, capex, and earnings can tip markets into a sharp repricing.
Stitching it together: how these threads could trigger a crash
Fiscal fragility meets foreign diversification: The U.S. needs to sell more debt at higher yields just as key foreign buyers (China, some sovereigns) are stepping back, and Moody’s has already downgraded U.S. credit. Higher yields → lower equity valuations → tighter credit → liquidity events. Reuters
Tariff‑driven inflation keeps real rates restrictive even if headline CPI looks “manageable,” stalling growth while the Fed can’t ease quickly. According to the Peterson Institute for International Economics: "tariffs as regressive, burdening the working class while leaving untaxed much of the income accruing to the wealthy. Today, less than 2 percent of government revenue in high-income countries comes from import taxes." PIIE, Bureau of Labor Statisticsureau of Labor Statistics
Confidence weakens beneath the surface: Expectations indices, retail sales in real terms, and a flatlining labor market erode earnings visibility. Downward guidance + higher discount rates = equity air pockets. The Conference Board.
Dollar psychology risk: The dollar probably won’t lose reserve status soon, but if the pace of diversification accelerates, Treasury liquidity and pricing could wobble, forcing policymakers into emergency measures—never great for risk assets. IMF Data
Put differently: no single indicator screams “imminent crash,” but the co-movement of higher structural rates, policy-induced inflation, weakening demand, and shrinking foreign sponsorship of U.S. debt raises the probability of a disorderly repricing.
What I’m watching next (and you should, too)
TIC data (Aug. 15 release for June 2025): Are China and other official holders still net sellers? U.S. Department of the Treasury
Conference Board Expectations Index: Does it stay <80 (historic recession signal) or recover? The Conference Board
Inflation path vs. tariff timeline: Do CPI and PCE services cool—even as new tariffs phase in? Vox, Bureau of Labor Statistics
Yield curve & term premium: Are long-end yields grinding higher despite stable Fed policy expectations? That’s a fiscal/term-premium story, not a growth one. Reuters
Dollar share in COFER 2025 updates: Does the share slip again after the Q4 2024 uptick? IMF Data
What to do now
How to be prepared for an economic recession:
1. Increase Cash Reserves
Cash provides flexibility during downturns to buy assets at lower prices or cover unexpected expenses without selling investments at a loss.
Build a 6–12 month emergency fund or consider shifting a small percentage of your portfolio into money market funds or high-yield savings accounts.
2. Focus on Defensive Stocks
Sectors like utilities, healthcare, and consumer staples tend to hold up better during economic contractions.
I always suggest dividend-paying stocks, especially Dividend Aristocrats or Dividend Kings, which have a track record of paying and raising dividends even in downturns.
3. Diversify Beyond Equities
A diversified portfolio reduces exposure to any single asset class.
Add bonds (especially U.S. Treasuries), gold, or low-volatility ETFs. Intermediate-term bonds can act as a buffer during market declines.
4. Reduce High-Risk Holdings
Overexposure to speculative assets (high-growth tech, crypto, or penny stocks) can magnify losses.
Rebalance your portfolio to limit exposure to volatile sectors or individual stocks.
5. Review Debt and Leverage
High interest rates during economic slowdowns make borrowing more expensive.
Pay down variable-rate debts (credit cards, HELOCs) and avoid taking on new, high-interest debt.
6. Continue to Dollar-Cost Averaging (DCA)
Volatile markets present opportunities to invest consistently and reduce timing risks.
Keep contributing to retirement accounts (401(k), IRA) and invest gradually over time, regardless of market conditions.
7. Explore Alternative Investments
Assets like real estate investment trusts (REITs) or commodities may act differently than stocks.
Action: Consider adding REITs that focus on essential infrastructure or commodity ETFs for diversification. Now is a good time to have 10 to 15 percent in cryptocurrencies.
Summary
We’re not in a reply of the2008-09 crash, when the global financial markets lost trillions of dollars in value, but we are layering in vulnerabilities for the financial markets:
· Foreign buyers of U.S. debt are diversifying
· Tariffs risk re‑accelerating inflation
· Consumer psychology is fragile, and macro data are middling at best.
None of these alone guarantees a crash. Together, they create concerns for a potential financial markets correction or even a crash.
All it may take is a policy misstep, a messy debt issuance cycle, or a geopolitical shock to cause investors to start to sell.
References & additional reading
China & Treasuries: Reuters: Foreign holdings of US Treasuries rise in May despite China drop (July 17, 2025); U.S. Treasury TIC release (July 17, 2025); CEIC data on China’s Treasury holdings; FT: China’s holdings of US Treasuries fall to lowest since 2009. ReutersU.S. Department of the TreasuryCEIC DataFinancial Times
Dollar reserves: IMF COFER data brief (Mar–Apr 2025); IMF blog Dollar Dominance in the International Reserve System (June 11, 2024); Columbia Threadneedle (Feb 2025). IMF DataIMFColumbia Threadneedle Investments
Tariffs & prices: PIIE Policy Brief PB24‑1 (2024); PIIE blog (2024); Vox analysis on tariffs and inflation; BLS CPI June 2025. PIIEPIIEVoxBureau of Labor Statistics
Confidence & macro: Conference Board Consumer Confidence (June 2025); University of Michigan (Reuters, July 18, 2025); Census retail sales June 2025; BLS unemployment June 2025. The Conference BoardReutersCensus.govBureau of Labor Statistics
Fiscal backdrop & market reactions: FT Foreign Treasury holdings remain near record high despite tariff turmoil (June 2025); Reuters Trump’s ‘big, beautiful’ bill… (June 30, 2025); Reuters market wrap (July 21, 2025). Financial TimesReutersReuters
About Floyd Saunders Floyd is the author of Figuring Out Wall Street and Five Paths to Wealth. His career included work with Bank of America, Citibank, JPMorgan, HRBlock, and TransAmerica as some of his clients. He has taught a variety of college courses dealing with financial markets and continues to write, here at this blog and several additional books.


Comments